fbpx ...
TROPHY POINT REALTY GROUP | SAVANNAH AREA REALTORS LOGO

Happy May! It’s time for another market update – let’s take a look at what April brought to the real estate market. While many have been waiting for a major slow-down in the real estate market, we’re still seeing homes fly off the shelves, especially in the $100-200k price range. Inventory is continually staying low, keeping the market hot.

General Market Trends

For the month of April in the entire Savannah MLS (which covers all of Chatham, Effingham, Bryan, and parts of Long and Liberty Counties), we have seen the following:

  • 1,333 new listings, compared to 1,402 new listings in March & 1,404 new listings in April of 2021
  • 967 homes sold, compared to 1,070 homes sold in March & 1,202 homes sold in April of 2021

There are 1,285 homes total on the market. This brings us to a total of 1.77 months of inventory, compared to 1.91 months of inventory in February, and 1.85 months worth in March. In a balanced market, we expect to see 6 months of inventory, so we are still very much in a seller’s market. Here, we can see the trends from the last 5 years of months of inventory (in green – remember, the balanced market is right around 6 months) & average home sale prices (in blue).savannah market update 1And this chart shows us the trends, also over the last 5 years, of the number of new listings (green) & number of houses sold (blue).savannah market update 2
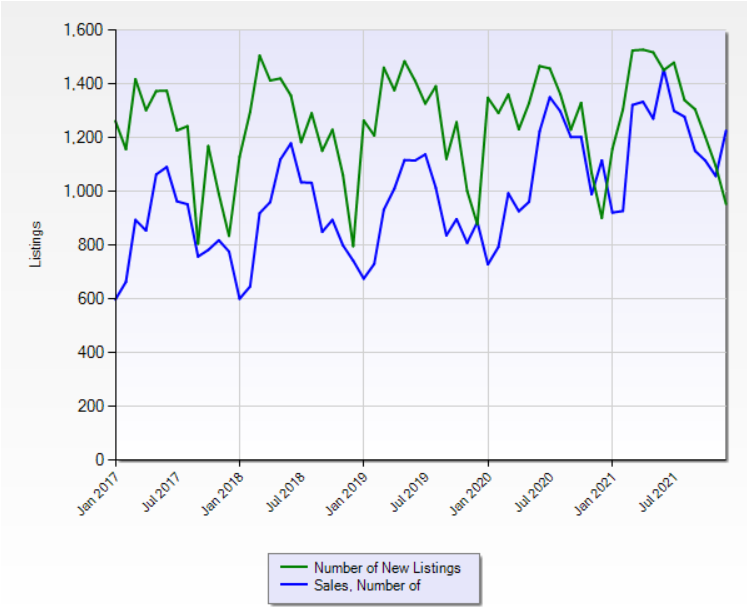
Another interesting trend we can see from this graph is the number of homes selling for under $250k around Savannah from the last 5 years.For those interested in multifamily homes, here are a few tidbits to look at: Savannah’s number of multifamily listings was up to 27 properties in April 2022, compared with 30 active in March 2022 and 22 last April (2021). This chart shows us trends over 5 years of number of new listings (in green) compared with the number of closings (in blue) for multifamily properties.And this will show the number of new listings (in green) compared with closings (in blue) over the last year.
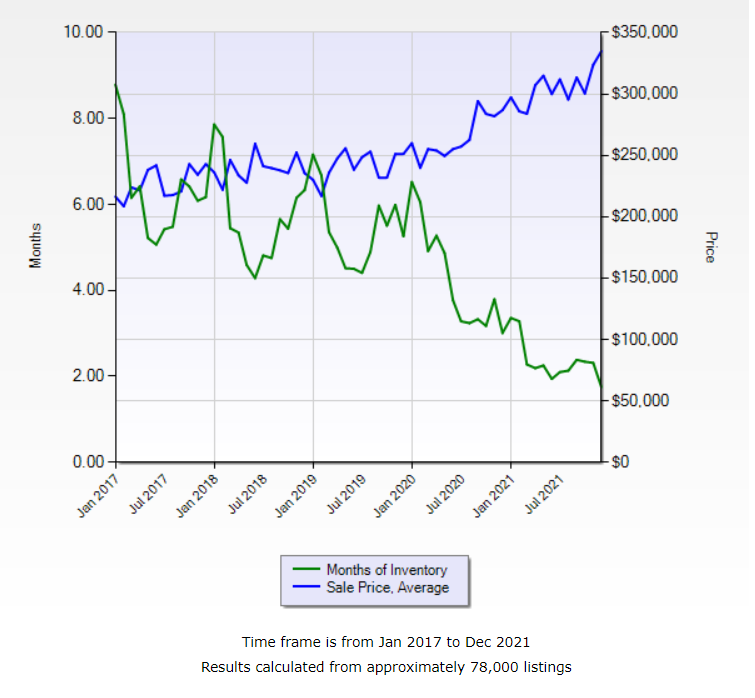
The fact that months of inventory continues to decrease even though the number of new listings is roughly in line with historic trends can point to only one thing – there are a lot of people moving to Savannah, and supply is not keeping up. This is great news if you’re a seller of course, not so much if you’re a buyer. The good news for buyers is this: population forecasts for the next five years point to a continued trend of migration to Savannah. We do not believe that prices will decline as long as folks are still moving here faster than they’re building houses; that’s basic economics. Interest rates rising have so far had little to no effect on the market. Some buyers are beginning to bow out of the market, but most are simply looking at lower price points. The other harsh truth for those in need of housing is this – rents have risen sharply over the past two years as well, and supply of available rentals is very tight. For example, on May the 2nd of this year we ran a search to see how many 3-bedroom rentals are available in Chatham county for less than $1600/mo. I counted five.  Two years ago, I would have been able to find 30 or more. If interest rates continue to climb, then they will eventually reach a point where they cool the market. When and if we get there is hard to say. We’ll be posting a blog within the next few weeks to share more information on these rising rates. If you’re interested in seeing some trends in individual neighborhoods or areas of the market, please keep scrolling. As always, we love to answer your questions – please don’t hesitate to reach out if you’d like to pick our brains about any of the information you see here today! Here is our index of neighborhoods:

  1. Ardsley Park/Chatham Crescent/Baldwin Park/Parkside
  2. The Islands
  3. Historic Districts
  4. Starland/Thomas Square/South Victorian District
  5. Eastside
  6. Pine Gardens/Savannah Gardens/Avondale “The States”/Victory Heights
  7. LaRoche/Fernwood/Glynnwood/Savannah State/Skidaway Terrace/Magnolia Park/Thunderbolt
  8. West Savannah
  9. Cloverdale/Tremont Park/Liberty City
  10. Cuyler Brownsville/Cann Park
  11. Midtwon
  12. Southside
  13. Georgetown/Chevis/Little Neck
  14. The Landings/Isle of Hope/Dutch Island/Burnside Island
  15. Berwick/Southbridge
  16. Garden City/Old Port Wentworth
  17. New Port Wentworth/North Pooler
  18. Pooler/Bloomingdale
  19. Rincon
  20. Guyton/Springfield
  21. Richmond Hill
  22. Keller
  23. Midway
  24. Hinesville

1. Ardsley Park/Chatham Crescent/Baldwin Park/Parkside

  • 29 new listings
    • 21 new listings in March 2022
    • 28 new listings this time last year (April 2021)
  • 18 properties sold
  • Average sale price: $464k
  • 5-year inventory of homes <$250k: 311
  • Price difference from last year to now: +$127k

2. The Islands

  • 74 new listings
    • 79 new listings in March 2022
    • 81 new listings this time last year (April 2021)
  • 61 properties sold
  • Average sale price: $435k
  • 5-year inventory of homes <$250k: 2,134
  • Price difference from last year to now: +$103k

3. Historic District

  • 25 new listings
    • 26 new listings in March 2022
    • 32 new listings this time last year (April 2021)
  • 17 properties sold
  • Average sale price: $899k
  • 5-year inventory of homes <$250k: 388
  • Price difference from last year to now: +$279k

4. Starland/Thomas Square/South Victorian District

  • 33 new listings
    • 34 new listings in March 2022
    • 30 new listings this time last year (April 2021)
  • 20 properties sold
  • Average sale price: $569k
  • 5-year inventory of homes <$250k: 420
  • Price difference from last year to now: +$179k

5. Eastside

  • 18 new listings
    • 21 new listings in March 2022
    • 18 new listings this time last year (April 2021)
  • 22 properties sold
  • Average sale price: $279k
  • 5-year inventory of homes <$250k: 802
  • Price difference from last year to now: +$45k

6. Pine Gardens/Savannah Gardens/Avondale “The States”/Victory Heights

  • 21 new listings
    • 21 new listings in March 2022
    • 26 new listings this time last year (April 2021)
  • 17 properties sold
  • Average sale price: $225k
  • 5-year inventory of homes <$250k: 916
  • Price difference from last year to now: +$73k

7. LaRoche/Fernwood/Glynnwood/Savannah State/Skidaway Terrace/Magnolia Park/Thunderbolt

  • 22 new listings
    • 37 new listings in March 2022
    • 33 new listings this time last year (April 2021)
  • 27 properties sold
  • Average sale price: $230k
  • 5-year inventory of homes <$250k: 1,237
  • Price difference from last year to now: +$18k

8. West Savannah

  • 6 new listings
    • 3 new listings in March 2022
    • 7 new listings this time last year (April 2021)
  • 2 properties sold
  • Average sale price: $76k
  • 5-year inventory of homes <$250k: 252
  • Price difference from last year to now: +$2k

9. Cloverdale/Tremont Park/Liberty City

  • 7 new listings
    • 9 new listings in March 2022
    • 8 new listings this time last year (April 2021)
  • 7 properties sold
  • Average sale price: $177k
  • 5-year inventory of homes <$250k: 473
  • Price difference from last year to now: +$27k

10. Cuyler Brownsville/Cann Park

  • 10 new listings
    • 14 new listings in March 2022
    • 11 new listings this time last year (April 2021)
  • 8 properties sold
  • Average sale price: $132k
  • 5-year inventory of homes <$250k: 465
  • Price difference from last year to now: +$52k
  •  

11. Midtown

  • 36 new listings
    • 40 new listings in March 2022
    • 44 new listings this time last year (April 2021)
  • 21 properties sold
  • Average sale price: $367k
  • 5-year inventory of homes <$250k: 945
  • Price difference from last year to now: +$129k

12. Southside

  • 83 new listings
    • 74 new listings in March 2022
    • 71 new listings this time last year (April 2021)
  • 71 properties sold
  • Average sale price: $236k
  • 5-year inventory of homes <$250k: 3,254
  • Price difference from last year to now: +$36k

13. Georgetown/Chevis/Little Neck

  • 62 new listings
    • 57 new listings in March 2022
    • 64 new listings this time last year (April 2021)
  • 67 properties sold
  • Average sale price: $268k
  • 5-year inventory of homes <$250k: 2,345
  • Price difference from last year to now: +$20k

14. The Landings, Isle of Hope, Dutch Island, Burnside Island

  • 42 new listings
    • 64 new listings in March 2022
    • 46 new listings this time last year (April 2021)
  • 39 properties sold
  • Average sale price: $541k
  • 5-year inventory of homes <$250k: 423
  • Price difference from last year to now: +$85k

15. Berwick/Southbridge

  • 46 new listings
    • 43 new listings in March 2022
    • 51 new listings this time last year (April 2021)
  • 39 properties sold
  • Average sale price: $395k
  • 5-year inventory of homes <$250k: 1,219
  • Price difference from last year to now: +$121k

16. Garden City/Old Port Wentworth

  • 9 new listings
    • 9 new listings in March 2022
    • 11 new listings this time last year (April 2021)
  • 5 properties sold
  • Average sale price: $199k
  • 5-year inventory of homes <$250k: 627
  • Price difference from last year to now: +$70k

17. New Port Wentworth/North Pooler

  • 42 new listings
    • 39 new listings in March 2022
    • 49 new listings this time last year (April 2021)
  • 32 properties sold
  • Average sale price: $310k
  • 5-year inventory of homes <$250k: 1,868
  • Price difference from last year to now: +$68k

18. Pooler/Bloomingdale

  • 106 new listings
    • 99 new listings in March 2022
    • 101 new listings this time last year (April 2021)
  • 75 properties sold
  • Average sale price: $311k
  • 5-year inventory of homes <$250k: 3,112
  • Price difference from last year to now: +$54k

19. Rincon

  • 97 new listings
    • 101 new listings in March 2022
    • 65 new listings this time last year (April 2021)
  • 63 properties sold
  • Average sale price: $304k
  • 5-year inventory of homes <$250k: 3,264
  • Price difference from last year to now: +$46k

20. Guyton/Springfield

  • 49 new listings
    • 83 new listings in March 2022
    • 66 new listings this time last year (April 2021)
  • 45 properties sold
  • Average sale price: $235k
  • 5-year inventory of homes <$250k: 3,567
  • Price difference from last year to now: +$13k

21. Richmond Hill

  • 90 new listings
    • 96 new listings in March 2022
    • 101 new listings this time last year (April 2021)
  • 68 properties sold
  • Average sale price: $308k
  • 5-year inventory of homes <$250k: 2,322
  • Price difference from last year to now: +$44k

22. Keller

  • 93 new listings
    • 72 new listings in March 2022
    • 70 new listings this time last year (April 2021)
  • 46 properties sold
  • Average sale price: $370k
  • 5-year inventory of homes <$250k: 601
  • Price difference from last year to now: +$49k

23. Midway

  • 48 new listings
    • 53 new listings in March 2022
    • 50 new listings this time last year (April 2021)
  • 37 properties sold

24. Hinesville

  • 72 new listings
    • 66 new listings in March 2022
    • 84 new listings this time last year (April 2021)
  • 55 properties sold
sell your home (1)

What Is Your Home Worth?

One of our expert agents will create a complimentary, personalized report that reveals your property’s potential. Together, we’ll strategize to maximize your return, ensuring you reap the benefits from your real estate investment.