March is here and with it, beautifully warm weather. Many people consider springtime to be the busier time of the year in real estate, and we’re certainly seeing a sight rise in the number of homes on the market. February’s listings came in at just under 1,100 homes compared to January’s 975 new listings. But more and more people are looking to buy, which still lands us heavy in a seller’s market. Let’s take a look, starting first with general trends and then dialing in on trends in your neighborhood.
General Market Trends
For the month of February in the entire Savannah MLS (which covers all of Chatham, Effingham, Bryan, and parts of Long and Liberty Counties), we have seen the following:
- 1,097 new listings, compared to 975 new listings in January & 1,167 new listings in February of last year, 2021
- 688 homes sold, compared to 739 homes sold in January & 805 homes sold in February of last year, 2021
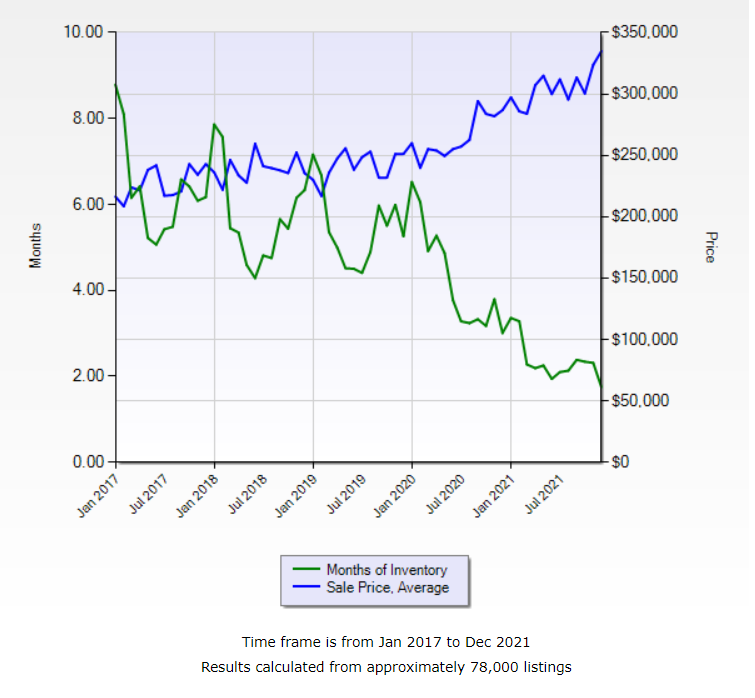
There were 1,314 homes total on the market in February. In January, there were 1,259. Last February, for more reference, there were 1,306 homes on the market. This brings us to a total of 1.93 months of inventory, compared to 1.85 months of inventory in January. In a balanced market, we expect to see 6 months of inventory, so we are still very much in a seller’s market
Here, we can see the trends from the last 5 years of months of inventory (in green – remember, the balanced market is right around 6 months) & median home sale prices (in blue).
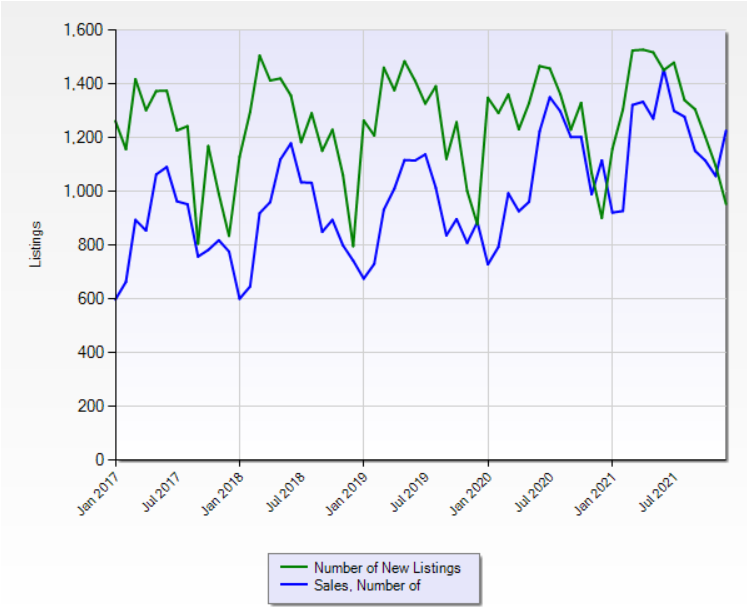
And this chart shows us the trends, also over the last 5 years, of the number of new listings (green) & number of houses sold (blue).
Here is our index of neighborhoods:
- Ardsley Park/Chatham Crescent/Baldwin Park/Parkside
- The Islands
- Historic Districts
- Starland/Thomas Square/South Victorian District
- Eastside
- Pine Gardens/Savannah Gardens/Avondale “The States”/Victory Heights
- LaRoche/Fernwood/Glynnwood/Savannah State/Skidaway Terrace/Magnolia Park/Thunderbolt
- West Savannah
- Cloverdale/Tremont Park/Liberty City
- Cuyler Brownsville/Cann Park
- Midtown
- Southside
- Georgetown/Chevis/Little Neck
- The Landings/Isle of Hope/Dutch Island/Burnside Island
- Berwick/Southbridge
- Garden City/Old Port Wentworth
- New Port Wentworth/North Pooler
- Pooler/Bloomingdale
- Rincon
- Guyton/Springfield
- Richmond Hill
- Keller
- Midway
- Hinesville
1. Ardsley Park/Chatham Crescent/Baldwin Park/Parkside

- 24 new listings
- 24 new listings in January
- 21 new listings this time last year (February 2021)
- 11 properties sold
- Average sold price: $412k
2. The Islands

- 63 new listings
- 50 new listings in January
- 79 new listings this time last year (February 2021)
- 34 properties sold
- Average sold price: $443k
3. Historic District

- 29 new listings
- 27 new listings in January
- 34 new listings this time last year (February 2021)
- 13 properties sold
- Average sold price: $644k
4. Starland/Thomas Square/South Victorian District

- 17 new listings
- 20 new listings in January
- 22 new listings this time last year (February 2021)
- 12 properties sold
- Average sold price: $436k
5. Eastside

- 22 new listings
- 21 new listings in January
- 15 new listings this time last year (February 2021)
- 7 properties sold
- Average sold price: $207k
6. Pine Gardens/Savannah Gardens/Avondale “The States”/Victory Heights

- 23 new listings
- 23 new listings in January
- 27 new listings this time last year (February 2021)
- 14 properties sold
- Average sold price: $236k
7. LaRoche/Fernwood/Glynnwood/Savannah State/Skidaway Terrace/Magnolia Park/Thunderbolt

- 26 new listings
- 30 new listings in January
- 26 new listings this time last year (February 2021)
- 17 properties sold
- Average sold price: $259k
8. West Savannah

- 3 new listings
- 9 new listings in January
- 5 new listings this time last year (February 2021)
- 4 properties sold
- Average sold price: $99k
9. Cloverdale/Tremont Park/Liberty City

- 6 new listings
- 14 new listings in January
- 3 new listings this time last year (February 2021)
- 16 properties sold
- Average sold price: $155k
10. Cuyler Brownsville/Cann Park

- 13 new listings
- 9 new listings in January
- 6 new listings this time last year (February 2021)
- 7 properties sold
- Average sold price: $121k
11. Midtown

- 22 new listings
- 27 new listings in January
- 27 new listings this time last year (February 2021)
- 17 properties sold
- Average sold price: $306k
12. Southside

- 63 new listings
- 56 new listings in January
- 53 new listings this time last year (February 2021)
- 42 properties sold
- Average sold price: $243k
13. Georgetown/Chevis/Little Neck

- 53 new listings
- 43 new listings in January
- 44 new listings this time last year (February 2021)
- 23 properties sold
- Average sold price: $246k
14. The Landings, Isle of Hope, Dutch Island, Burnside Island

- 38 new listings
- 41 new listings in January
- 58 new listings this time last year (February 2021)
- 25 properties sold
- Average sold price: $597k
15. Berwick/Southbridge

- 31 new listings
- 35 new listings in January
- 46 new listings this time last year (February 2021)
- 26 properties sold
- Average sold price: $316k
16. Garden City/Old Port Wentworth

- 13 new listings
- 23 new listings in January
- 6 new listings this time last year (February 2021)
- 3 properties sold
- Average sold price: $170k
17. New Port Wentworth/North Pooler

- 42 new listings
- 30 new listings in January
- 40 new listings this time last year (February 2021)
- 31 properties sold
- Average sold price: $285k
18. Pooler/Bloomingdale

- 69 new listings
- 75 new listings in January
- 81 new listings this time last year (February 2021)
- 67 properties sold
- Average sold price: $311k
19. Rincon

- 85 new listings
- 47 new listings in January
- 65 new listings this time last year (February 2021)
- 29 properties sold
- Average sold price: $285k
20. Guyton/Springfield

- 34 new listings
- 29 new listings in January
- 63 new listings this time last year (February 2021)
- 38 properties sold
- Average sold price: $256k
21. Richmond Hill

- 68 new listings
- 54 new listings in January
- 55 new listings this time last year (February 2021)
- 37 properties sold
- Average sold price: $307k
22. Keller

- 35 new listings
- 31 new listings in January
- 51 new listings this time last year (February 2021)
- 34 properties sold
- Average sold price: $401k
23. Midway

- 22 new listings
- 29 new listings in January
- 34 new listings this time last year (February 2021)
- 23 properties sold
24. Hinesville

- 60 new listings
- 64 new listings in January
- 52 new listings this time last year (February 2021)
- 44 properties sold