Trending
Featured Articles
Filter by Categories or Explore All Our Articles Below.
October 16, 2025
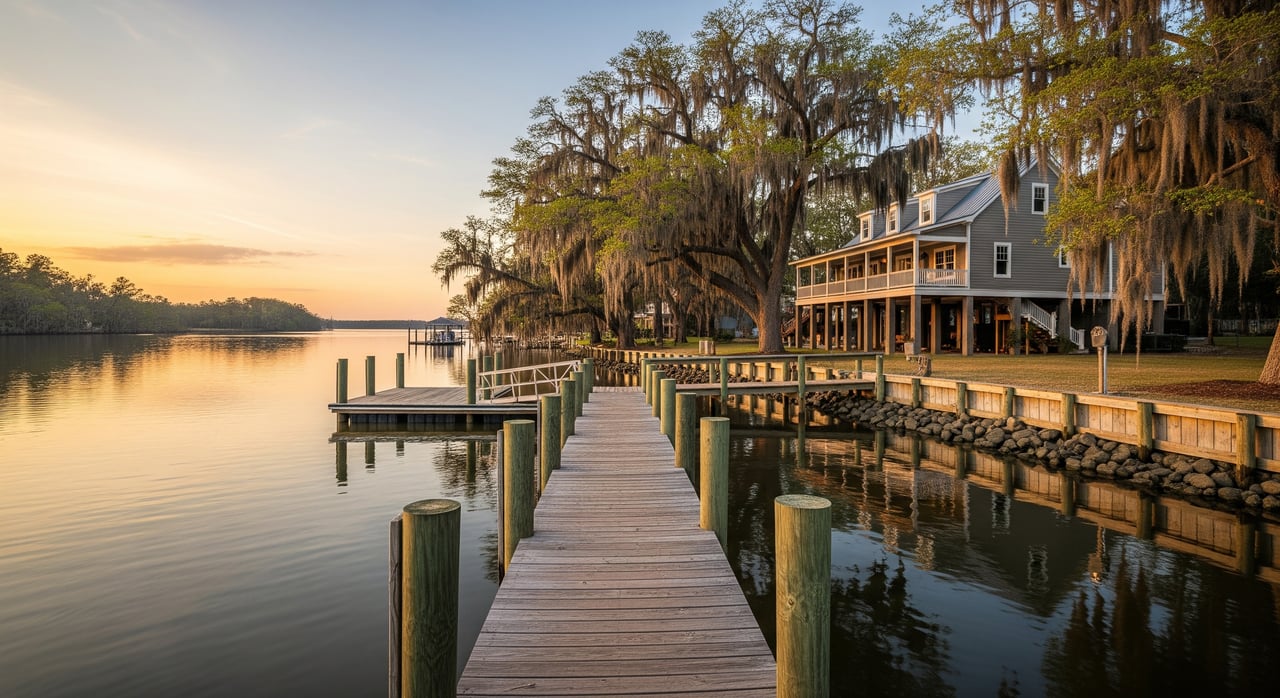
Waterfront Appraisals in Georgetown: What Lenders Check
Read more
July 23, 2026
The Richmond Hill Summer Calendar Runs Through Heartwood And J.F. Gregory, Not Highway 17
Read more
July 9, 2026
The 2026 Restaurant Wave Is Redrawing Downtown Savannah's Dining Map
Read more
June 4, 2026
Creative Living In Savannah’s Starland District: Homes And Hangouts
Read more
July 16, 2026
What Pooler's Flat Median Isn't Telling You About Buying In 2026
Read more
July 16, 2026